
Home  Products
 System software
 SiBEMS
 Products
 System software
 SiBEMS
SiBEMS
Dash board
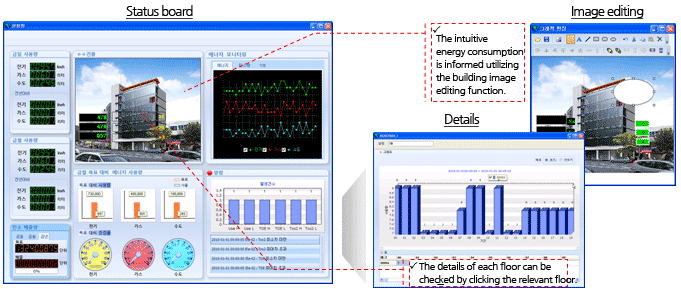
- The overall energy use status and analysis details are provided and, as to the matters of interest, a detailed list can be searched through the related item tracking function.
- Function summary : Amount used today, amount used in this month, carbon emission, energy information of each floor, consumption versus target, alarm list, and energy details of each floor can be checked.
Inquiry about energy consumption
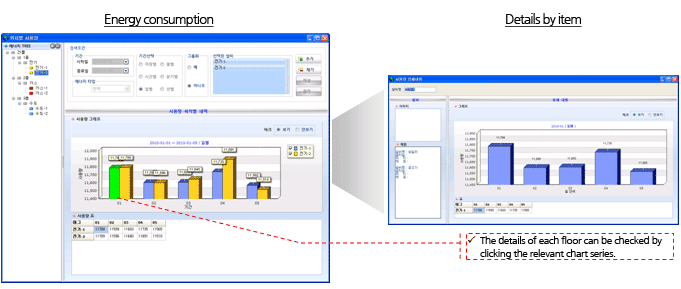
- Energy consumption details of each group or tag set in the energy tree are inquired about in the form of a table or graph depending on diverse conditions.
- Function summary : Energy consumption can be inquired about in the form changed depending on conditions through diverse search conditions, and drill down inquiries can be made about the energy data of the distal end by clicking the graph series for which the details are required to make the details to pop up.
Consumption calendar
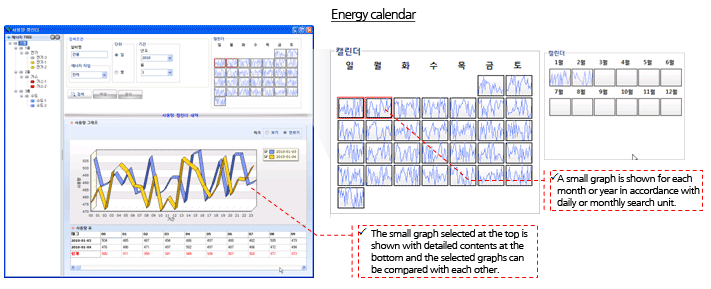
- When energy consumption is inquired about, a consumption calendar is shown in the form of thumbnail, and the details of the relevant day or month are added for mutual comparison when a specific date is clicked.
- Function summary :
- Monthly or annual calendar for energy consumption is shown through search conditions.
- When the relevant days or months in the calendar are selected, the details of all the days and months selected are additionally shown.
Energy analysis
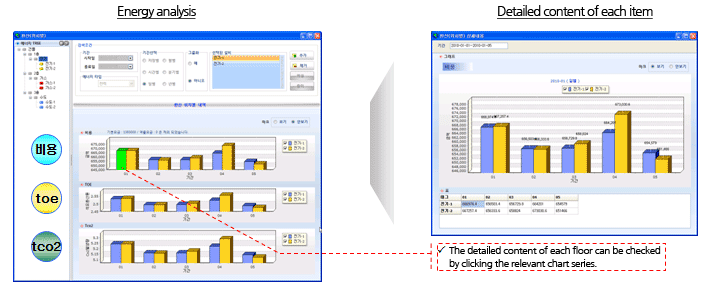
- The cost incurred from energy consumption, and the details of conversion made for TOE (Ton of Oil Equivalent), and TCO2 (Carbon Emission) of each group or tag set in the energy tree can be inquired about in the form of table or graph in accordance with diverse conditions.
- Function summary : The cost incurred from energy consumption, and the details of conversion made for TOE (Ton of Oil Equivalent), and TCO2 (Carbon Emission) can be inquired about in the form changed depending on conditions, and drill down inquiries can be made about the energy analysis data of the distal end by clicking the graph series for which the details are required to make the details pop up.
Report
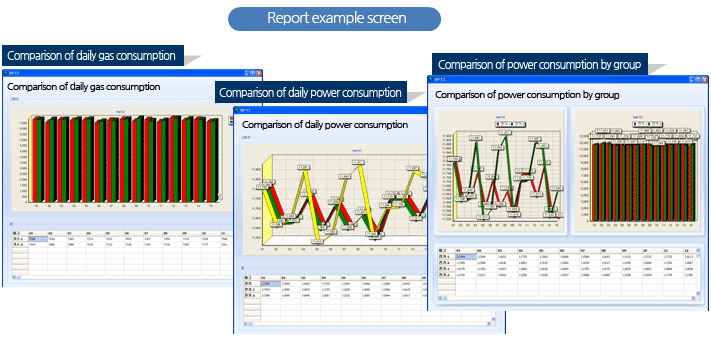
- A report can be generated for each user using the Wizard in the form of graph or table in accordance with the purpose, and the reports generated may be shared with other users by granting the authority.


